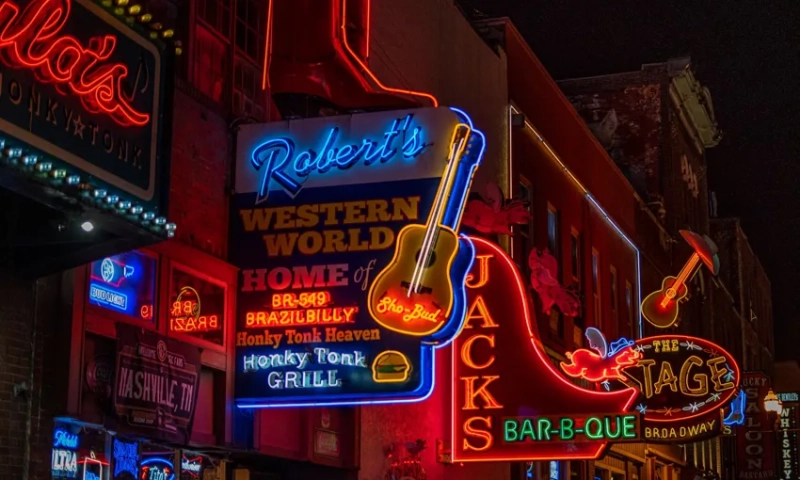
Knowland reported that Nashville saw an uptick in meetings and events in April, growing 38.0 percent year-over-year (YoY). Las Vegas continued a steady climb with 22.8 percent YoY growth. This data is sourced from Knowland’s sales intelligence platform and designed to help hoteliers protect and grow their revenue base.
Overall meeting volume growth was flat for the industry at a 1.3 percent increase YoY. The average space used for meetings in the Top 25 markets was 3,768 sq. ft., and secondary markets were at 3,684 sq. ft. Average attendees also grew slightly to 133 in the Top 25, while secondary markets averaged 127 attendees.
- Top five markets by YoY growth in event volume – Nashville was a favorite meeting spot in April, ranking highest growth in the Top 25 U.S. markets with an average space use of 3,885 sq ft for 131 average attendees. National Associations were the key driver with events such as the Association of Physical Plant Administrators. Below is additional insight into the top industry drivers for these markets.
- Nashville, Tenn. (+38.0 percent): National Association, Technology, Health Care, Financial / Banking, and Charity/Non-Profit/Social Services.
- Las Vegas (+22.8 percent): Technology, National Association, Wedding, Health Care, and Training/Education.
- New York (+20.2 percent): Education, Financial/Banking, Health Care, Technology, and Travel.
- Seattle (+15.2 percent): National Association, Charity/Non-Profit/Social Services, Technology, Education, and Consulting.
- Tampa-St. Petersburg, Fla. (+11.1 percent): Wedding, National Association, Healthcare, Financial, and Manufacturing.
- Top five secondary markets by YoY growth in event volume – Louisville, Ky.-Ind. saw an uptick of 188 percent in event bookings, with Charity/Non-Profit as the leading industry driver. The five high-growth secondary markets and top industries were:
- Louisville, Ky.-Ind. (188.0 percent) – Charity/Non-Profit/Social Services
- Maui Island, Hawaii (87.1 percent) – Insurance
- Greensboro-Winston Salem, NC (79.7 percent) – Training / Education
- Michigan South (78.5 percent) – Charity/Non-Profit/Social Services
- Florida Keys, Fla. (72.8 percent) – Arts / Performing Arts
About the Data: This data is provided to help hoteliers still building momentum gain insight into the top locations selected by today’s meeting planners. This information about the leading industry drivers provides a clear picture of those groups that are returning to the meeting and event space. Insights presented result from the analysis of meetings and events data acquired through Knowland data collection and aggregation methods, including field reporting and automated methods of customer and non-customer data collection in primary, secondary, and tertiary markets, as well as its large historical database.
